Shiba inu (SHIB) whales went bargain hunting early this week after prices dropped to a 16-month low of $0.00001005.
According to CoinDesk’s AI research, whales purchased 10.4 trillion SHIB tokens, worth over $110 million, on Monday, marking the largest daily accumulation in five months.
The whale action has likely contributed to the cryptocurrency’s 17% price bounce from the 16-month low reached Sunday. Note that the broader crypto market has stabilized following the initial knee-jerk reaction to the tensions in the Middle East. BTC, which fell below $100K over the weekend, last changed hands near $106,000.
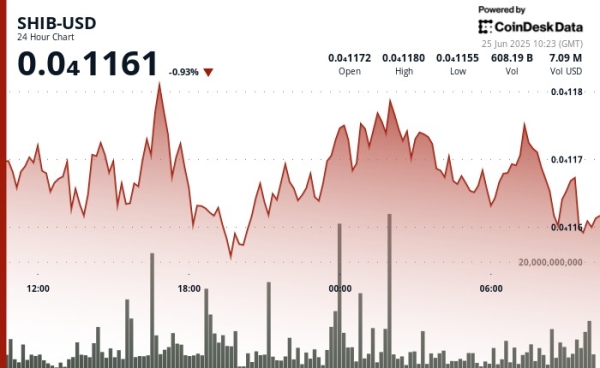
Market data indicate that SHIB is maintaining a generally constructive posture, with higher lows forming a subtle uptrend channel. The token found significant volume support at the $0.00001158 level during the 24 hours from June 24, 09:00 to June 25, 08:00, with trading volume surging to 439 billion, well above the daily average.
This accumulation at support levels suggests the potential for continued upside momentum if the $0.00001175 resistance can be decisively cleared. As of writing, SHIB traded at around $0.00001162 on major exchanges, according to CoinDesk data.
Key AI insights
Higher lows formed a subtle uptrend channel, suggesting accumulation at support levels and potential for continued upside momentum if $0.00001175 resistance is cleared.
During the 60 minutes from 25 June 07:06 to 08:05, SHIB climbed from $0.00001169 to $0.00001171, representing a 0.2% gain.
A significant price surge occurred between 07:25-07:27, with volume peaking at 12.36 billion SHIB as prices reached the session high of $0.00001175.
Price action formed an ascending channel with higher lows, though a sharp correction at 08:03 tested the $0.00001171 support level, suggesting consolidation after the earlier rally.
Hourly chart
SHIB’s recovery has stalled since Tuesday, with prices trading in what appears to be a descending triangle, characterized by a falling trendline and a horizontal support line.
SHIB’s hourly price chart. (TradingView/CoinDesk)
A price move through the descending trendline would signal a continuation of the recovery rally, exposing the June 16 resistance above $0.00001230. Conversely, a breakdown of the triangle would signal a bearish reversal lower.

 Bitcoin
  Ethereum
  XRP
XRP  Tether
  BNB
BNB  Solana
  USDC
USDC  Dogecoin
  Cardano
  Wrapped stETH
  Wrapped Bitcoin
  Hyperliquid
  Stellar
  Sui
Sui  Wrapped eETH
  Bitcoin Cash
  WETH
WETH  Ethena USDe
  Hedera
  Avalanche
  Litecoin
  Toncoin
  LEO Token
  USDS
USDS  Shiba Inu
  Binance Bridged USDT (BNB Smart Chain)
  WhiteBIT Coin
  Coinbase Wrapped BTC
  Polkadot
  Ethena Staked USDe
  Ethena
  Pepe
Pepe  Aave
Aave  Bittensor
  NEAR Protocol
  Ondo
Ondo  Aptos
Aptos  Pi Network
  OKB
OKB  Jito Staked SOL
  Binance-Peg WETH
  BlackRock USD Institutional Digital Liquidity Fund
  Arbitrum
  USD1
USD1  Algorand
  Pudgy Penguins
  POL (ex-MATIC)
  Cosmos Hub
  VeChain
  Rocket Pool ETH
  Fasttoken
  Gate
Gate  Render
  sUSDS
sUSDS  Bonk
Bonk  Worldcoin
  Binance Staked SOL
  Artificial Superintelligence Alliance
  Jupiter Perpetuals Liquidity Provider Token
  Sky
Sky  Official Trump
  Filecoin
  Story
Story  StakeWise Staked ETH
  SPX6900
  Flare
Flare  Liquid Staked ETH
  Mantle Staked Ether
  KuCoin
  Jupiter
  USDtb
USDtb  USDT0
USDT0  NEXO
NEXO  Injective
  Lido DAO
  Optimism
  Falcon USD
  Curve DAO
  Celestia
  Tether Gold
  Pump.fun
  Polygon Bridged USDT (Polygon)
  Solv Protocol BTC
  Kinetiq Staked HYPE
  Jupiter Staked SOL
  Immutable
  FLOKI
FLOKI  Binance Bridged USDC (BNB Smart Chain)
  Conflux
  Arbitrum Bridged WBTC (Arbitrum One)
  The Graph
  Aerodrome Finance
  Super OETH
  PAX Gold
  SyrupUSDC
  clBTC
clBTC  Ethereum Name Service
  cgETH Hashkey Cloud
  dogwifhat
  Virtuals Protocol
  Kaia
Kaia  Fartcoin
  Marinade Staked SOL
  Raydium
  JasmyCoin
  IOTA
IOTA  GALA
GALA  MemeCore
  ether.fi Staked ETH
  L2 Standard Bridged WETH (Base)
  Mantle Restaked ETH
  OUSG
OUSG  tBTC
tBTC  Pyth Network
  Ondo US Dollar Yield
  Stables Labs USDX
  Stader ETHx
  Ripple USD
  Jito
Jito  BUILDon
  Coinbase Wrapped Staked ETH
  Arbitrum Bridged WETH (Arbitrum One)
  Zcash
Zcash  AB
AB  Flow
Flow  Keeta
Keeta  Usual USD
  Avalanche Bridged BTC (Avalanche)
  Telcoin
  Binance-Peg Dogecoin
  Bitcoin SV
  Swell Ethereum
  Decentraland
  Solv Protocol Staked BTC
  Brett
Brett  Reserve Rights
  Beldex
  USDD
USDD  Polygon PoS Bridged WETH (Polygon POS)
  TrueUSD
  Ether.fi
  dYdX
dYdX  Starknet
  ApeCoin
  Core
Core  Rekt
Rekt  THORChain
  Arweave
  Compound
  Onyxcoin
  APENFT
  Savings Dai
  Trip
Trip  NEO
NEO  Zebec Network